Fathom takes pride in our best-in-class reporting and we’ve just added new features to make this area of Fathom even better for our users.
Our thoughtfully designed reporting features allow users to transform their financial data into actionable insights to share with stakeholders in clear, compelling, and efficient ways. Learn about how our latest product releases improve the report editing experience and add new options for measuring KPI results.
Two new KPI reporting components for Consolidated Groups
'KPIs by Company': See how individual companies within a group perform across key metrics
Our new ‘KPIs by Company’ table provides a side-by-side view of KPI performance for companies within your consolidated group. Use this table to measure results for all KPIs, including custom metrics.
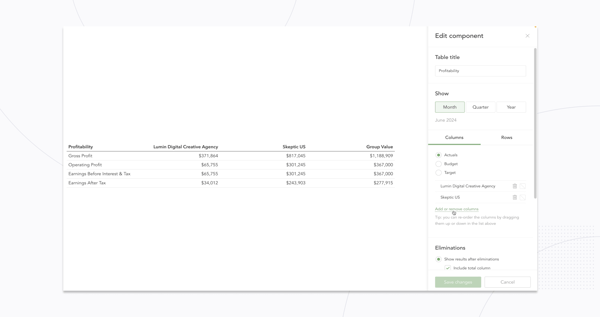
The 'KPIs by Company' table also enables you to compare budgets or targets for each company.
You can see how results compare to the groups’ totals which display in an optional total column in the table.
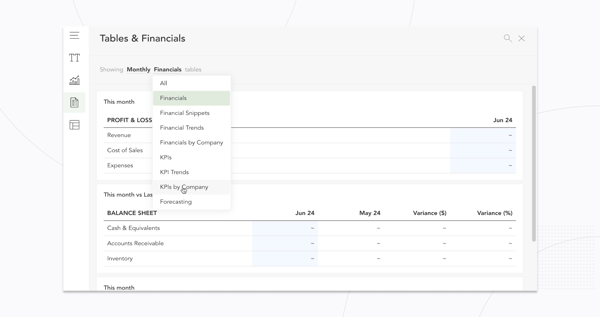
You’ll find the new 'KPIs by Company' table under ‘Tables and Financials’ within the component gallery while editing a Fathom report.
'KPI Comparatives': Focus on your most important metrics
The new 'KPI Comparatives' table provides a side-by-side view of individual company performance for a single KPI within the context of a consolidated group.
This table can also be filtered to show results for a specific company or multiple companies. Add comparison columns to see how results compare to the target, budget, or prior period results.
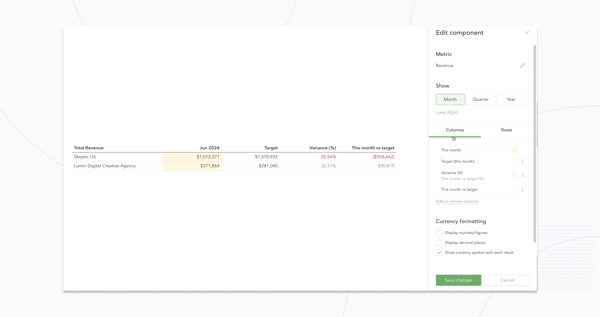
You’ll find the 'KPI Comparatives' table within ‘Tables and Financials’ within the component gallery while editing a Fathom report.
Deeper insights: comparisons added to the Breakdown Chart
The Breakdown tool in Fathom shows how individual companies within a consolidated group, or individual tracking categories (class, location, etc.) within a company, perform against a specific measure.
Last year we added new comparison options to the Breakdown Analysis tool giving users the options to compare to prior periods or budget numbers.
We’re now bringing these comparative options through to the Breakdown component within reports, so these insights can be saved and shared with key stakeholders.
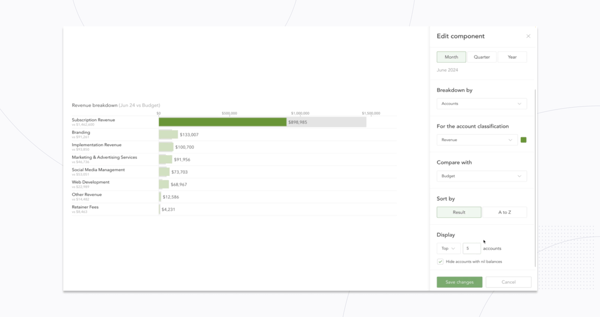
You’ll find the Breakdown Chart within the component gallery under Charts in a custom Fathom report.
Easier editing using Undo and Redo
Have you spent time creating the perfect chart, graph, or text component in a report, only to realise there's been a mistake?
Easily backtrack using the ‘undo’ button to revert to the previous version of your report component.
You’ll find the ‘undo’ and ‘redo’ options in the top right corner while editing a custom Fathom report.